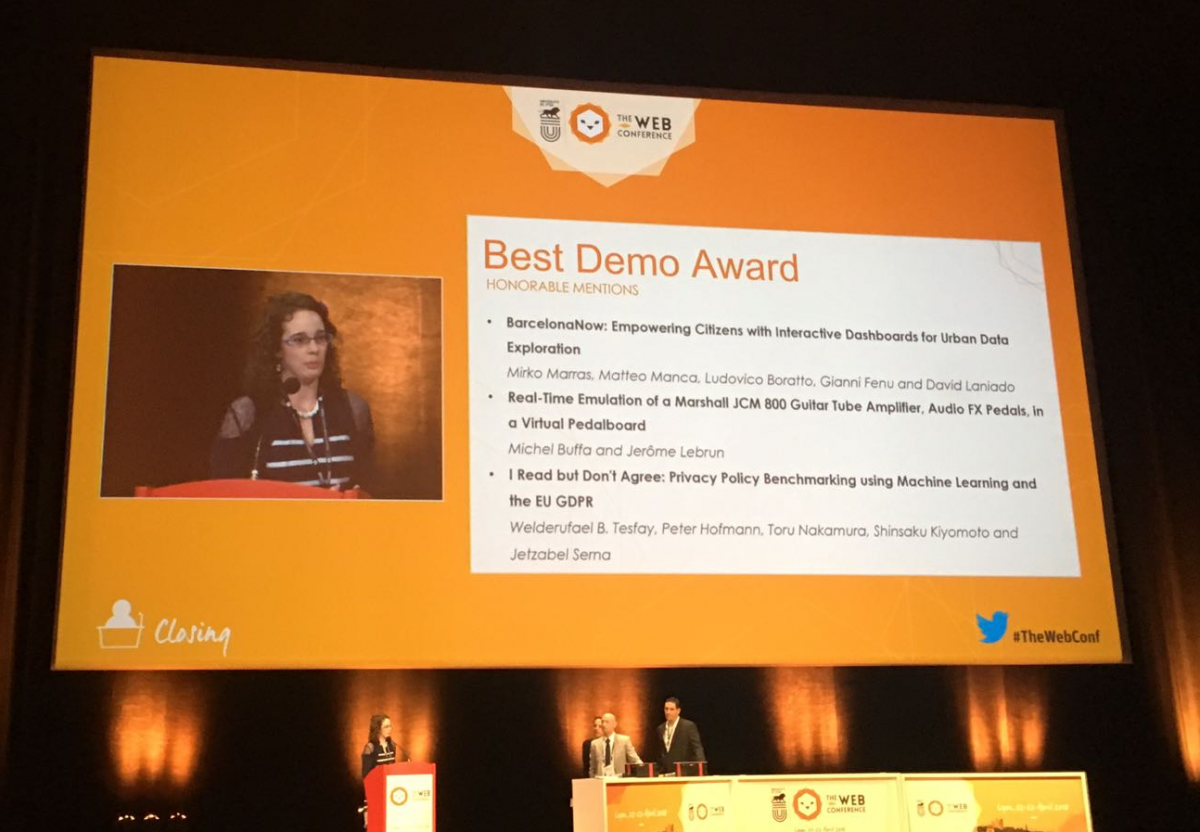
The BarcelonaNow dashboard was presented by Eurecat’s Data Science and Big Data Analytics team as a demonstration entitled “BarcelonaNow: Empowering Citizens with Interactive Dashboards for Urban Data Exploration” at “The Web Conference 2018” (former WWW), held on 23-27 April 2018 in Lyon (France).
This was the 27th edition of the largest conference on the World Wide Web, aimed to provide the premier international forum where researchers and practitioners from different disciplines, sectors, communities and backgrounds, gathered from across the world, can discuss and debate about the continuous evolution of the Web, the standardization of its associated technologies, and their impact on society and culture. This year, 2000+ attendees from 60+ countries had the opportunity to participate to 11 research tracks, 7 alternate tracks, 27 workshops, 21 tutorials, 30 demos, 62 posters, 4 panels, 4 challenge tracks, 1 developer track, and 1 industry track.
Within this world premier conference, the goal of our demonstration was to illustrate how BarcelonaNow can be used for empowering citizens to explore city-related data within a set of personalized dashboards. BarcelonaNow presence during the conference was accompanied by:
-
the dashboard demo available online;
-
the poster presented together with the demo;
-
the paper published in the conference proceedings;
-
a short presentation of the main dashboard capabilities.
The demonstration raised interest among the audience and stimulated discussion on the current capabilities of the dashboard from the perspective of both city councils and citizens, and on how the dashboard could be improved with the integration of private data from the DECODE infrastructure. During the Awards Ceremony, BarcelonaNow received an honorable mention as one of the best three demos among a total of 30 demos presented during the whole conference.
In brief, BarcelonaNow aims to make data not only available to and responsibly shareable by citizens, but also useful for their purposes, closing the cycle by providing a visual environment populated by interactive interfaces for data exploration and visualization. While the existing urban dashboards include limited pre-defined use cases that can only address the most common needs of citizens, with BarcelonaNow, we propose an open source environment that enables citizens to easily explore city-related data on the basis of their specific goals. A back-end continuously collects heterogeneous data, turns them into a unified format and exposes them through APIs; a front-end allows users to create interactive visualizations by combining different data sources and visual models, and to share them to engage others. In this way, citizens can build up a data-driven public awareness supporting an open, transparent, and collaborative city.
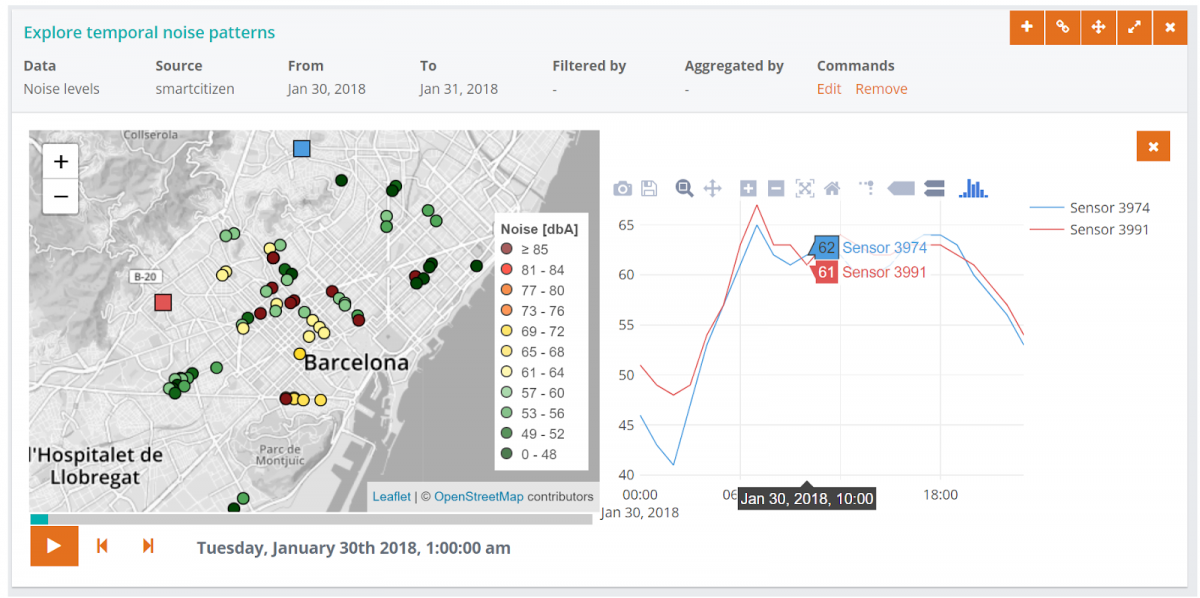
More specifically, on the basis of their goals, users can create personalized dashboards and move widgets between them. Then, each dashboard can be shared with a link. The sample dashboard below includes a widget showing noise temporal patterns associated to 50 sensors from SmartCitizen. The right part shows the time series for the two sensors selected on the left (shown as squares).
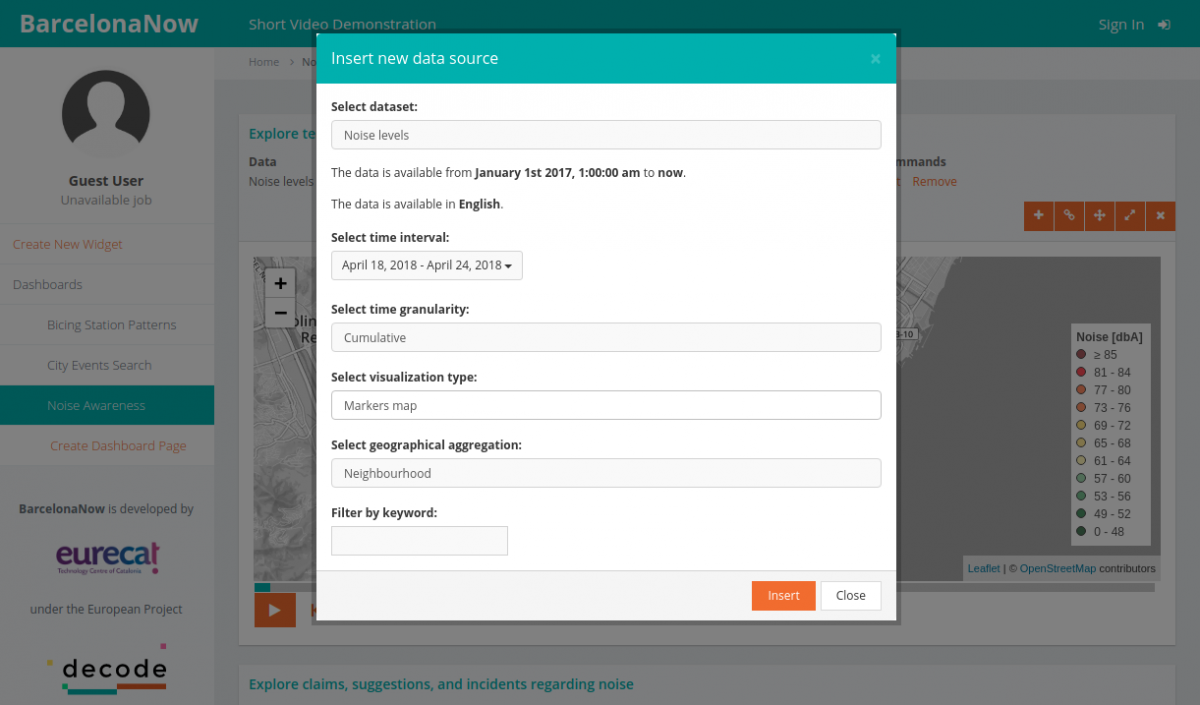
Users can create a new widget and insert a visualization within it by selecting the name of the data source to be visualized and additional parameters such as the time interval, the time granularity, the visual model, and the geographical granularity. The figure below shows the visual interface used to insert a new visualization within a dashboard widget.
The dashboard is conceived to integrate public data from Barcelona City Council sources:
-
City events from ASIA (Aplicatiu de Sistemes Integrats d’Atenció), the system that keeps an up to date record of all city buildings and their usage, and a day to day agenda of all public activities held on public buildings.
-
Citizens’ complaints from IRIS (Incidències, Reclamacions i Suggeriments), the “citizen relation system” of the city, where all demands and requirements are stored and classified according to a predefined ontology.
-
Bike sharing data from ODI (Open Data Infrastructure), the open data portal of the city council.
-
Sensors data from Sentilo, the “IoT sensor platform” of the city.
-
Data from CityOS, an internal data lake of the city council, currently under final stages of development
-
Participation process data from Decidim Barcelona, the city’s participatory democracy platform (next step!).
In addition to these public data sources, some external data sources are integrated:
-
Sensors data from the Smart Citizen platform.
-
Airbnb scraped data from InsideAirbnb.
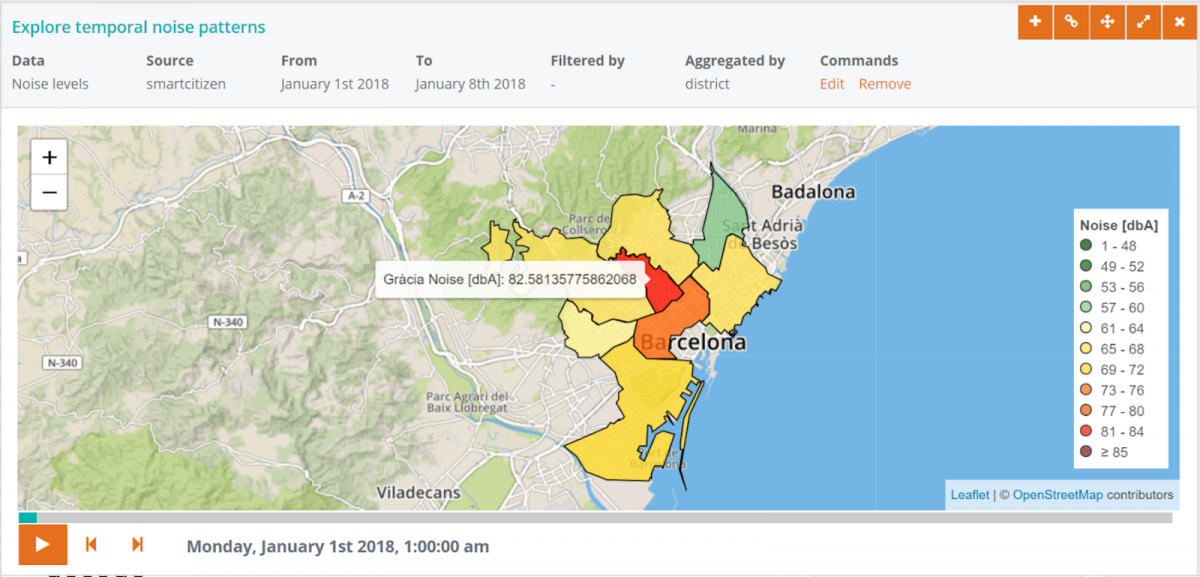
Leveraging the described functionalities and data sources, users can create the widget shown below by geographically aggregating noise sensor measurements, as an example. In this way, users can quantify the average noise level by district during a given time interval and identify the city areas more affected by noise pollution.
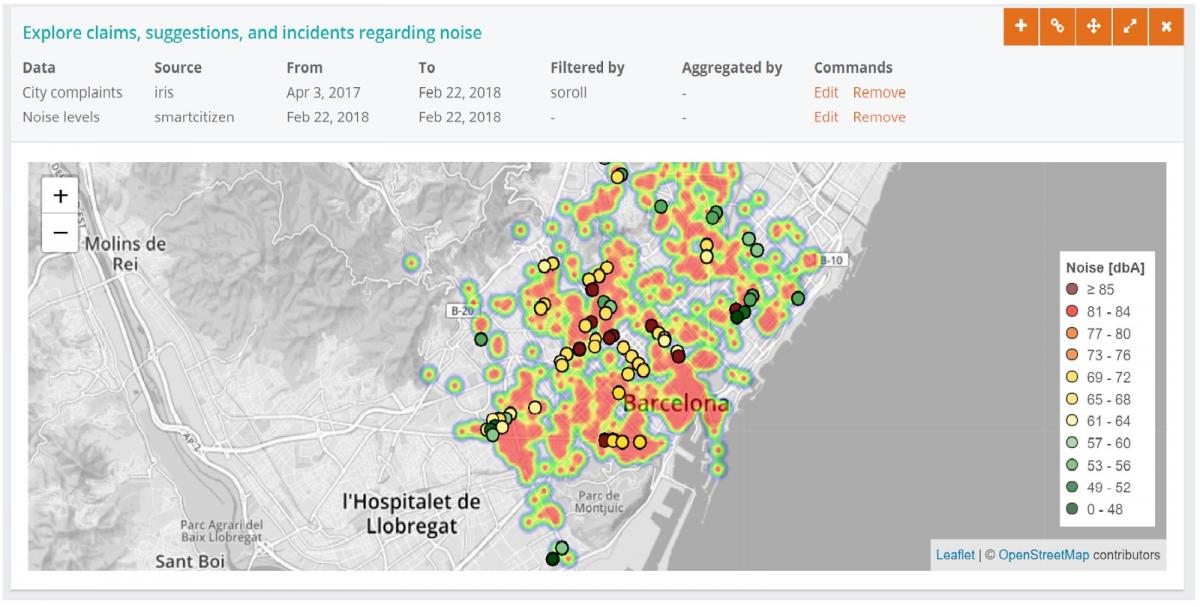
Users can also compare and visualize more data sources within the same widget, representing them in diverse layers and with diverse visual models. For instance, the widget below shows noise levels from SmartCitizen (markers) and noise complaints distribution from IRIS (heat-map: hotter colors for higher complaints density in the corresponding area).
In the next steps, we plan to extend the existing data catalog with other public data sources and with users’ private data from the DECODE infrastructure to enable the creation of personalized privacy-aware visualizations. In addition, we will allow citizens to explore data with other visual models and the underlying support of advanced data mining techniques. More details about BarcelonaNow and its future developments can be retrieved on our latest deliverable entitled “D5.3 Data analysis methods and first results from pilots”.
 DECODE was funded by the European Union's Horizon 2020 Programme, under grant agreement number 732546.